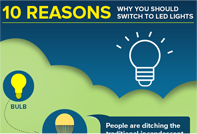
Why an Infographic?
An infographic is not just a picture, it’s a way to generate interest in the reader. By turning complex data into intuitive visual representation, websites can generate traffic and sales. No wonder, why businesses who market with infographics grow in traffic an average of 12% more than those who don’t.
When we read, only 1% of the information gets through our brain and 40% of people respond better to visual information than plain text. A well-created infographic will leave a long lasting impression on viewers, thus giving you a solid brand identity.

Tell a Story with Numbers and Make it Heard
We turn complex information and data into interesting graphics that are not only easy to understand but also visually appealing. We use creative layouts, backgrounds and color schemes, In other words, we create & submit infographics that stand out of the box.
How Do We Make Interesting Infographics?
 Research
We look out for design ideas trending in the industry. We research, brainstorm and analyze
-

 Creation
We visualize this data to turn it into an impressive graphic
-

 Promotion
We share these visuals across different channels and promote them.

- We help you share your brand’s story with the rest of the world with creative infographic writing
- Whatever your business goals are, we understand them and create infographic specific to your industry
- For us, deadlines is what matters. We assure a timely delivery without compromising on quality
- We have a carefully selected team comprising of creative, skilled designers, and marketers
Infographics are the way of social media!
Infographics give authors a new and exciting way to engage with their audience, through visuals that also provide helpful information. To make an infographic truly effective in generating interest from viewers on any platform it needs more than just informative content – like good design does for web pages or print documents; this is what will keep them coming back again and again because they’re interested not only by what’s being said but how easily accessible all those words become when presented visually as well- which means you should brush up on graphic designing skills if your goal isn’t simply publishing something quickly without much effort put into making things look pretty while still delivering its message clearly enough.
Our Pricing Model

- Research and script
- Initial Concept -1
- Upto 2 revisions
- Web Ready File
- Source PSD: No
- White Label: No
- 1 Week Turnaround
- PDF Version: Yes
- Infographic posted to 10 accounts
- Dedicated Project Manager
- Time 7-12 Days

- Research and script
- Initial Concept -2
- Upto 3 revisions
- Web Ready File
- Source PSD: No
- White Label: Yes
- 1 Week Turnaround
- PDF Version: Yes
- Infographic posted to 15 accounts
- Dedicated Project Manager
- Time 7-12 Days

- Research and script
- Initial Concept -3
- Upto 4 revisions
- Web Ready File
- Source PSD: Yes
- White Label: Yes
- 1 Week Turnaround
- PDF Version: Yes
- Infographic posted to 20 accounts
- Dedicated Project Manager
- Time 7-12 Days


 Login
Login


